Tutorial 3: Animation/Projectile Motion
Moving Sine Wave
To have a sine wave which moves i.e. is animated the function must somehow depend on time. One way to do this is to modify the angle argument: y = A * sin(k * x + w * t). Modify your code from last week’s tutorial:
- Typedef a ‘struct { float t, lastT, dt; } Global’ and declare a variable `Global g’ which stores ‘t’ (and ‘lastT’ and ‘dt’, although not used at this stage).
- Use glutGet to set the value of ‘g.t’
- Use ‘g.t’ when drawing the sine wave. Use a value of w=π/4 and values of k and A from last week.
Projectile Motion: Example code
Start with the projectile motion example code from the lecture available here. Compile this code with the usual flags and then run it.
Note that the code includes an update (or idle) function, which is set using the function callback glutIdleFunc(update); This registers the update function with glut so it can be called automatically, just like the display function. The update function will be called continuously, which makes it ideal for running any game logic or calculating any animation. The function also calls glutPostRedisplay() which ensures that the display function will be called each frame.
The update function also includes a calculation of a dt variable, which stores how much time has elapsed between each frame (in seconds). This is useful for numerical integration, which works using changes in time. It also includes a calculation of a t variable, which is how much overall time has elapsed, which is useful for analytical integration.
While previous example code has included a glutKeyboardFunc callback, this week’s code includes the use of the ‘s’ key to start the animation, as well as the ‘i’ key to toggle between analytical and numerical integration.
Note that the program includes code to draw an on screen display or OSD showing frame rate and frame time.
- Make sure you understand how the projectile state has been initialised, so far it contains an initial position and an initial velocity (which is used for analytical integration), as well as a current position and current velocity (which is used for numerical integration).
- The code contains two functions,
updateProjectileStateAnalyticalwhich performs analytical integration, andupdateProjectileStateNumericalwhich performs numerical euler integration. Make sure you understand how these work.
Drawing the Projectile
- First draw the world axes just as you did last week, with green for y, red for x and blue for z.
- Currently the program draws a point to represent the projectile. Replace the point drawing code in the display function with glutWireSphere. Use glTranslate to draw the sphere in the right position, and put the glTranslate inside a glPushMatrix, glPopMatrix pair so that only the sphere is drawn with the translation. Make sure the circle/sphere is rendered at the correct position, and with a reasonable radius (eg. 0.05).
- Try changing the code inside the
keyboardCBfunction, so that the animation starts when you hit the spacebar, instead of the ‘s’ key. - Constrain the circle projectile so that it cannot go below 0 on the y axis, (eg. all animation stops when it reaches that point).
Extra:
Implement your own circle drawing function based on the lecture notes. Use parametric coordinates, i.e. angles and x=cos(θ) and y=sin(θ).
Velocity Vector

- Vectors can be represented in polar or cartesian coordinates. In polar coordinates a vector is represented by a magnitude and angle pair (r, θ). To convert from polar coordinates (r, θ) to cartesian coordinates (x, y) is simple: x = r × cos(θ), y = r × sin(θ). It is likewise simple to convert from cartesian coordinates to polar coordinates.
- In some situations it is more natural to think in and use polar coordinates. For projectile motion it might be aiming the projectile with an angle and speed/magnitude. Or for a jumping frog, its jump speed and angle.
- Add a vec2fPolar type with magnitude and angle fields/members to the code. Declare a variable initVel of that type. Don’t forget to initialise it, use a value that makes sense, e.g. (1.0, 60.0).
- Have the ‘a’ key increase the value of the rotation by a constant amount and have the ‘d’ key decrease the rotation. Print the value of the rotation variable to ensure it is working.
- Now have the ‘w’ key increase the value of the speed/magnitude, and ‘s’ decrease the value, just as you did for the rotation. Print this value to ensure your code is working.
- Convert the initial velocity vector to cartesian coordinates, storing the result in the projectile variable’s v0 field. Be careful about using trignometry functions sinf and cosf which expect angles in radians (whereas OpenGL rotation functions use degrees!). Define utility functions: degToRad and radToDeg. Make sure you recalculate the conversion whenever the angle or speed changes.
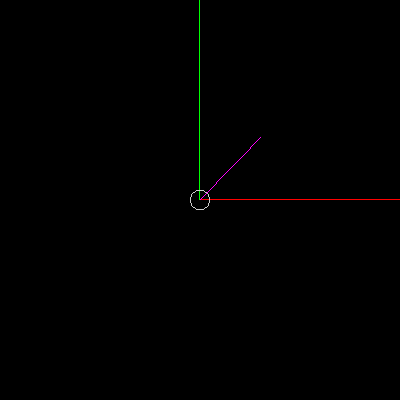
- Draw the velocity vector at the location of the circle, using drawVector from last week’s tutorial. Make sure it updates properly, and that the motion of the circle matches the vector when you press the spacebar (You may need to scale down the length of this vector so that it isn’t too big when you draw it).
Extra: Smooth rotation/speed
It is possible to have the rotation/speed update smoothly using the callback functions
glutKeyboardFuncto set a key flag to true for a key that is pressed and theglutKeyboardUpFuncto set that flag to false. You can then check the value of this flag in theidlefunction and increase or decrease the value of the rotation by 45 degrees per second when the appropriate key is being held down (as well as usingdtto change the speed). Leave this for now and come back to it later after finishing the rest of the tutorial
Drawing the Parabola

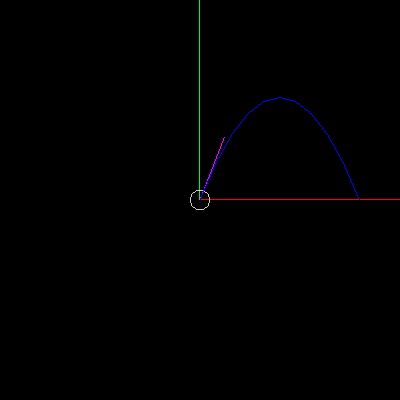
- Add a function drawTrajectoryAnalytical for drawing the projecile’s trajectory as a parabola (similar to your quadratic drawing code from last week). This time use the parametric equations for projectile motion as given in the lecture notes (or on wikipedia). To do this calculate the time of flight, i.e. the time the projectile takes until it hits the ground at y=0, as in the lecture notes, and wikipedia. Divide the curve in to a given number of segments, i.e. divide the t range by the specified number of segments and use that in your loop similar to the tutorial last week.
- Confirm that the parabola updates correctly when you adjust the velocity vector, and that the projectle correctly follows this path when animating.
- Now instead use numerical integration to calculate and draw the trajectory, use a different function drawTractoryNumerical. Start t at 0 and increase it by a fixed amount
dt(called a time step) each iteration until some condition is satisfied, e.g. y < 0.0, when the projectile hits the ground plane. Try dt=0.001 i.e. 1ms. Now try dt=0.01 i.e. 10ms, and dt=0.1 i.e. 100ms. Any difference? What is a reasonable value to use? *Any difference between the analytical and numerical trajectories: draw them both and compare! - Now add code to draw normals and tangents to the trajectory. OpenGL does not allow nested glBegin statements, so add a second for loop after the first, which iterates over the same values. Use this loop to draw normal and tangent vectors to the parabola. Add a case for the key ‘t’ to turn tangent vector rendering on and off, as well as key ‘n’ to turn normal rendering on and off. Add normal/tangent vector rendering for the circle as well.