Graphics performance is often measured by framerate, in frames per second, usually abbreviated as fps but more scientifically correct as f/s. Frametime is the inverse of framerate, and is usually measured in milliseconds per frame, i.e. ms/f.
Whilst framerate is an intuitive and important measure, and relates directly to the user's real-time experience, it has the property of reducing as the processing time increases, whereas frametime increases.
Another aspect of timing is that when using doubling/halving of tesselation (or other parameters) need to be careful about having a non-linear scale. A doubling of tesselation in each direction gives a four-fold increase in the number of polygons.
Use the attached spreadsheet, which has measured times from a program. Use libreoffice (which should open automatically). Use a 'scatter graph' and cntl to select different columns
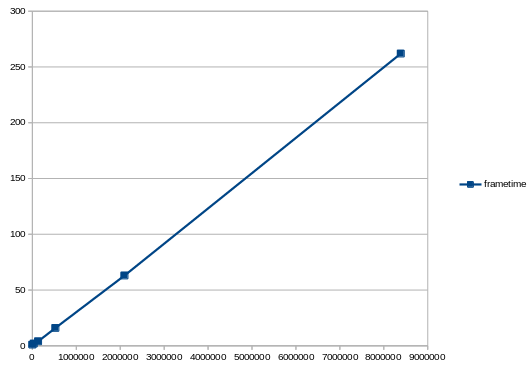
Plot the following graphs:
Which graph shows the performance relationship between the variables most clearly? What is that relationship? What do these result say about the bottleneck?